Places where Residents Invest the Most
Studies show that more and more Americans, whether because of their own financial literacy or through the urging of financial advisors, are investing. Data from the Survey of Consumer Finances shows that 52% of families in the U.S. have assets in retirement accounts as of 2016, up from 37% in 1989. But not all Americans across the country invest at the same rate.
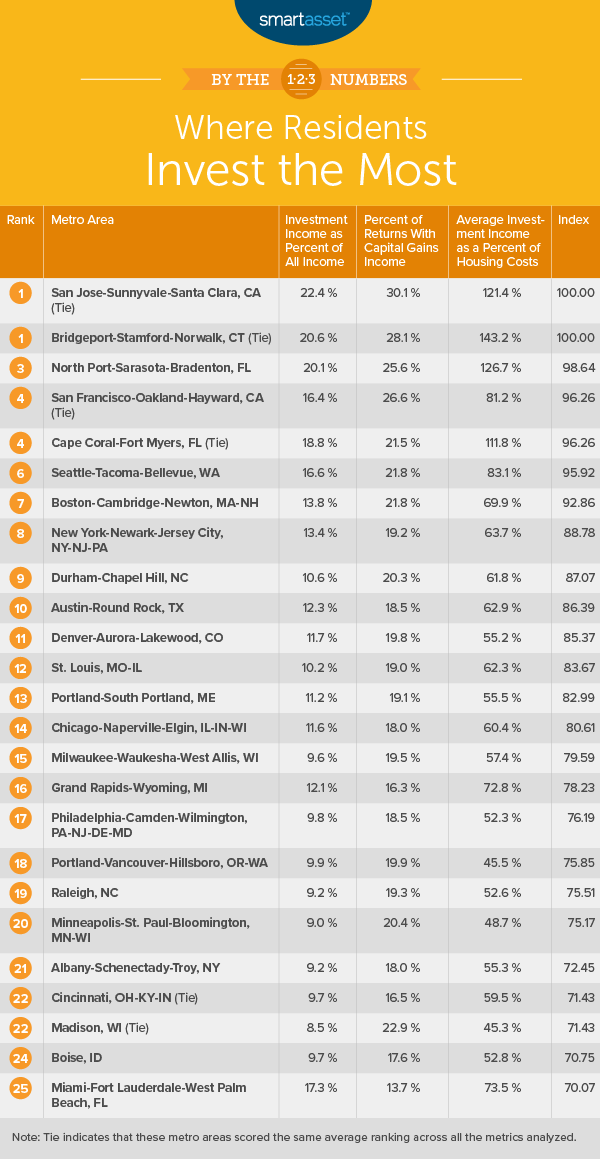
Below, we look at data to find the places where residents are investing the most. To do this, we looked at data for three factors: investment income as a percent of average income, percent of returns with capital gains income and average investment income as a percent of local housing costs. Check out our data and methodology below to see where we got our data and how we put it together to create our final ranks.
Key Findings
- High-income metro areas invest more, even accounting for the cost of living. - The average cost of living across our top-10 places where residents invest the most is $18,500. The annual cost of living in the bottom-10 metro areas is $12,300.
- Central California dominates the bottom. - There are four California metro areas in the bottom 10. They are Riverside, Bakersfield, Stockton and Fresno.
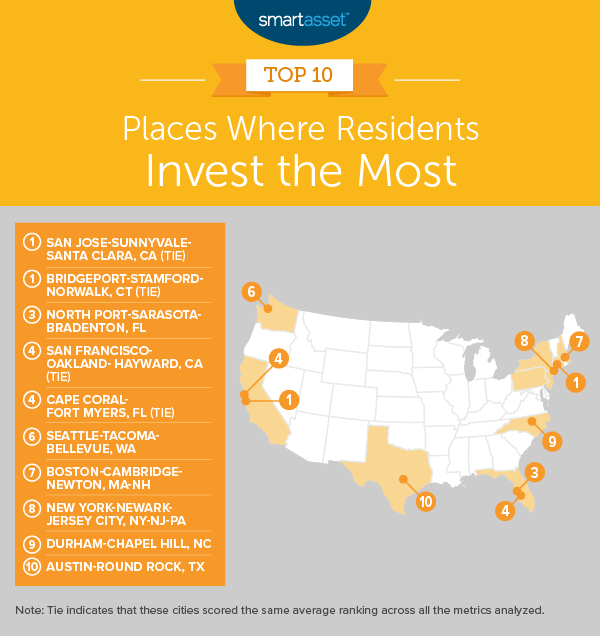
- (tie) San Jose-Sunnyvale-Santa Clara, CA The San Jose metro area shares the top spot with the Bridgeport metro area. It was a tight race between the two, with both of them scoring in the top three for all metrics. San Jose came out on top in investment income as a percent of average tax return income and first for percent of tax returns with capital gains income. More than 30% of tax returns here reported income from capital gains.
- (tie) Bridgeport-Stamford-Norwalk, CT As mentioned above, Bridgeport comes in tied for first. This metro area ranked second for investment income as a percent of average income and percent of tax returns with capital gains income. Bridgeport did take the top spot for average investment income as a percent of local housing costs. Average investment income in the Bridgeport metro area is equal to over 140% of local annual housing costs.
- North Port-Sarasota-Bradenton, FL Despite scoring no worse than fourth in any metric, North Port Florida and its outlying metro area landed in the third spot on our list. Relative to housing costs, the investment income coming into the North Port metro area is particularly high. If the average household here earned the average amount on its investments, those investments would be worth equal to 127% of local annual housing costs. For that metric, this metro area ranked second.
- (tie) San Francisco-Oakland-Hayward, CA The San Francisco metro area is another high-income area, but investment income is not quite as important to locals here: It is worth only 16% of income on the average tax return. In that metric, the San Francisco metro area ranks seventh. But while investment income is not the be-all and end-all for the average San Francisco resident's budget, many San Francisco metro area residents do invest. According to our data, just under 27% of San Francisco tax returns reported capital gains income.
- (tie) Cape Coral-Fort Myers, FL The Cape Coral metro area is the second Florida metro area to crack this top 10. Its consistency keeps it high on this list, as this metro area ranks in the top 10 in every metric. In particular, the relative amount of investment income is high. Investment income is equal to 19% of total income for the average resident, and average investment income is worth 12% more than the annual average housing costs. That means that for the average resident, investment income alone could pay for housing. The only problem in Cape Coral is that not everyone invests. Slightly more than 21% of residents report capital gains income.
- Seattle-Tacoma-Bellevue, WA Coming in sixth is the largest metro area in the Evergreen State. The Seattle metro area ranked sixth for both investment income as a percent of all income and percent of tax returns with investment income. The high cost of housing makes the investment income less valuable than in metros ranked above, though. Average investment income is equal to 83% of annual housing costs in Seattle, the seventh-best score.
- Boston-Cambridge-Newton, MA-NH The metro area belonging to Massachusetts' capital comes in seventh. Boston and the surrounding area also ranked in the top 10 for three of the metrics, but it was still not able to rank higher than seventh. Its best score was in percent of tax returns with capital gains income. According to data from the IRS, just under 22% of tax returns reported income from capital gains in the Boston metro area. In that metric, Boston took the seventh spot.
- New York-Newark-Jersey City, NY-NJ-PA The Big Apple's metro area comes in eighth. For the most part, residents do not rely on investment income to make ends meet or pay for their expensive housing here, two facts that hurt this metro area's overall ranking. Investment income makes up slightly more than 13% of overall income and is equal to just under 64% of annual housing costs. Fewer than 20% of New York metro area tax returns reported income from capital gains.
- Durham-Chapel Hill, NC In ninth is the Durham-Chapel Hill metro area. This metro ranked in the top 20 for all our metrics, but its highest score was only 10th. In investment income as a percent of overall income, Durham ranked 18th. In percent of tax returns with capital gains income, Durham ranked 10th, and in average investment income as a percent of annual housing costs, Durham ranked 15th.
- Austin-Round Rock, TX Investment income in Austin is fairly high for its ranking. In both investment income as a percent of overall income and average investment income as a percent of annual housing costs, Austin ranks in the top 15. However, not everyone in Austin is getting in on the investment action. This metro area ranks only 22nd for percent of returns with capital gains income.
Data and Methodology
In order to rank the places where residents are investing the most, we looked at data for the 100 largest metro areas. Specifically, we compared them over the following three metrics:
- Investment income as a percent of overall income. This is total investment income, including income from dividends and capital gains, as a percent of all income.
- Percent of tax returns with capital gains income. This is the number of tax returns reporting capital gains income divided by the total number of tax returns.
- Average investment income as a percent of annual housing costs. This is average investment income divided by annual housing costs.
Data on investment income and tax returns comes from the IRS and is for 2016. Data on housing costs comes from the Census Bureau's 2017 1-Year American Community Survey.
Tips for Making the Most of Your Investments
- Start early - Time is the most important factor when it comes to investing. Even if you only have a few thousand dollars to start, investing today allows you to harness the power of compound interest to help secure your retirement.
- Get an expert's help - How should I invest my money? This can be a stressful terrain to navigate. A financial advisor can help make sure your investments are optimized to your needs. If you're not sure where to find a financial advisor, check out SmartAsset's financial advisor matching tool.
Questions about the study? Contact us at press@smartasset.com
Find Financial Advisors by City
Learn more about financial advisors in your area below through our detailed advisor profiles organized by location. That's just one of the ways that we make it easier to find and research financial advisors. You can also find nearby financial advisors through our matching tool, which matches you up to three financial advisors in your area, and you can review your advisor matches at no cost to decide which is right for you.
Find Financial Firms by City
Learn more about financial advisor firms in your area below through our detailed advisor profiles organized by location. That's just one of the ways that we make it easier to find and research financial advisor firms. You can also find nearby financial advisors through our matching tool, which matches you with up to three financial advisors in your area, and you can review your advisor matches at no cost to decide which is right for you.